
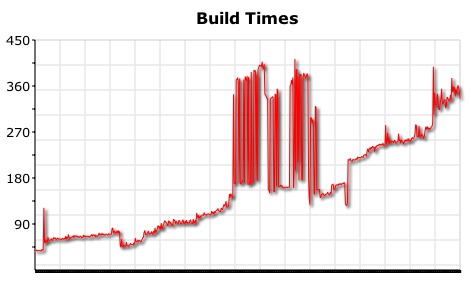
node.js: Building a graph of build times using the Go API
I’ve been playing around with node.js again and one thing that I wanted to do was take a CSV file generated by the Go API and extract the build times so that we could display it on a graph.
Since I don’t have a Go instance on my machine I created a URL in my node application which would mimic the API and return a CSV file.
I’m using the express web framework to take care of some of the plumbing:
dashboard.js
var express = require('express')
var app = express.createServer();

app.get('/fake-go', function(req, res) {
  fs.readFile('go.txt', function(err, data) {
    res.attachment("data.csv");
    res.end(data, 'UTF-8');
  });
});
go.txt is just in my home directory and looks like this:
cruise_agent,cruise_job_duration,cruise_job_id,cruise_job_result,cruise_pipeline_counter,cruise_pipeline_label,cruise_stage_counter,cruise_timestamp_01_scheduled,cruise_timestamp_02_assigned,cruise_timestamp_03_preparing,cruise_timestamp_04_building,cruise_timestamp_05_completing,cruise_timestamp_06_completed,tests_failed_count,tests_ignored_count,tests_total_count,tests_total_duration
TheOriginalAndTheBest,275,1812,Passed,647,0.647,1,2011-08-02T14:48:33+01:00,2011-08-02T14:48:45+01:00,2011-08-02T14:48:56+01:00,2011-08-02T14:48:57+01:00,2011-08-02T14:53:11+01:00,2011-08-02T14:53:32+01:00,0,0,375,0.076
TheOriginalAndTheBest,20,1815,Cancelled,648,0.648,1,2011-08-02T15:09:32+01:00,2011-08-02T15:09:46+01:00,2011-08-02T15:09:56+01:00,2011-08-02T15:09:56+01:00,,2011-08-02T15:10:17+01:00,,,,
TheOriginalAndTheBest,268,1817,Passed,649,0.649,1,2011-08-02T15:14:20+01:00,2011-08-02T15:14:30+01:00,2011-08-02T15:14:40+01:00,2011-08-02T15:14:41+01:00,2011-08-02T15:18:49+01:00,2011-08-02T15:19:09+01:00,0,0,368,0.074
TheOriginalAndTheBest,272,1822,Passed,650,0.650,2,2011-08-02T15:30:31+01:00,2011-08-02T15:30:41+01:00,2011-08-02T15:30:51+01:00,2011-08-02T15:30:52+01:00,2011-08-02T15:35:05+01:00,2011-08-02T15:35:24+01:00,0,0,368,0.083
TheOriginalAndTheBest,271,1825,Passed,651,0.651,1,2011-08-02T15:38:33+01:00,2011-08-02T15:38:44+01:00,2011-08-02T15:38:54+01:00,2011-08-02T15:38:54+01:00,2011-08-02T15:43:06+01:00,2011-08-02T15:43:26+01:00,0,0,368,0.093
I wanted to create an end point which I could call and get back a JSON representation of all the different builds.
app.get('/go/show', function(req, res) {
  var site = http.createClient(3000, "localhost");
  var request = site.request("GET", "/fake-go", {'host' : "localhost"})
  request.end();
  request.on('response', function(response) {
    var data = "";
    response.setEncoding('utf8');

    response.on('data', function(chunk) {
      data += chunk;
    });

    response.on('end', function() {
      var lines = data.split("\n"), buildTimes = [];
      lines.forEach(function(line, index) {
        var columns = line.split(",");
        if(index != 0 && nonEmpty(columns[9]) && nonEmpty(columns[11]) && columns[3] == "Passed") {
          buildTimes.push({ start :  columns[9], end : columns[11]});
        }
      });

      res.contentType('application/json');
      res.send(JSON.stringify(buildTimes));
    });
  });
});

function isEmpty(column) {
  return column !== "" && column !== undefined
}
I should probably use underscore.js for some of that code but I didn’t want to shave that yak just yet!
I have a default route setup so that I can just go to localhost:3000 and see the graphs:
app.get('/', function(req, res){
  res.render('index.jade', { title: 'Dashboard' });
});
On the client side we can then create a graph using the RGraph API:
index.jade
h2(align="center") Project Dashboard
script
  function drawGoGraph(buildTimes) {
    var go = new RGraph.Line('go', _(buildTimes).map(function(buildTime) { return (new Date(buildTime.end) - new Date(buildTime.start)) / 1000 }).filter(function(diff) { return diff > 0; }));
    go.Set('chart.title', 'Build Times');
    go.Set('chart.gutter.top', 45);
    go.Set('chart.gutter.bottom', 125);
    go.Set('chart.gutter.left', 50);
    go.Set('chart.text.angle', 90);
    go.Set('chart.shadow', true);
    go.Set('chart.linewidth', 1);

    go.Draw();
  }

  $(document).ready(function() {
    $.getJSON('/go/show', function(data) {
	  drawGoGraph(data);
    });
  });

div(align="center")
  canvas(id="go", width="500", height="400")
    [Please wait...]
We just do some simple subtraction between the start and end build times and then filter out any results which have an end time before the start time. I’m not entirely sure why we end up with entries like that but having those in the graph totally ruins it!
We include all the .js files in the layout.jade file.
layout.jade
!!! 5
html(lang="en")
  head
    title Project Dashboard
    script(src='RGraph/libraries/RGraph.common.core.js')
    script(src="RGraph/libraries/RGraph.common.context.js")
    script(src="RGraph/libraries/RGraph.common.annotate.js")
    script(src="RGraph/libraries/RGraph.common.tooltips.js")
    script(src="RGraph/libraries/RGraph.common.zoom.js")
    script(src="RGraph/libraries/RGraph.common.resizing.js")
    script(src="RGraph/libraries/RGraph.line.js")
    script(src="jquery-1.6.2.min.js ")
    script(src="underscore-min.js")
Et voila:
About the author
I'm currently working on short form content at ClickHouse. I publish short 5 minute videos showing how to solve data problems on YouTube @LearnDataWithMark. I previously worked on graph analytics at Neo4j, where I also co-authored the O'Reilly Graph Algorithms Book with Amy Hodler.