
Visualising a neo4j graph using gephi
At ThoughtWorks we don’t have line managers but people can choose to have a sponsor - typically someone who has worked in the company for longer/has more experience in the industry than them - who can help them navigate the organisation better.
From hearing people talk about sponsors over the last 6 years it seemed like quite a few people sponsored the majority and there were probably a few people who didn’t have a sponsor.
It seemed like a pretty good problem to visualise in a graph so I got access to the data, spent a few hours tidying it up so all the names matched the names we have in our staffing application and then loaded it into neo4j.
I initially tried to visualise the data in sigma.js but that didn’t work that well here - I think it’s much better when we actually want to browse around a graph whereas here I’m just interested in an overall snapshot.
I therefore decided to load the data into gephi and find a way of visualising it using that.
The relationships on the graph are like this:
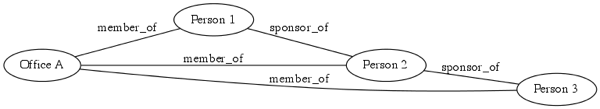
I created this using the following graphviz definition:
graph effectgraph {
	size="8,8";
	rankdir=LR;

	person1[label="Person 1"];
	person2[label="Person 2"];
	person3[label="Person 3"];
	officeA[label="Office A"];

	officeA -- person1 [label="member_of"];
	officeA -- person2 [label="member_of"];
	officeA -- person3 [label="member_of"];
	person1 -- person2 [label="sponsor_of"];
	person2 -- person3 [label="sponsor_of"];
}
dot -Tpng v3.dot >> sponsors.pngI wrote a script based on Max de Marzi’s blog post to get the data into gexf format so that I could load it into gephi:
First I get a collection of all the people who are sponsors and how many sponsees they have:
def load_sponsors
 query =  " START n = node(*)"
 query << " MATCH n-[r:sponsor_of]->n2"
 query << " RETURN ID(n), count(r) AS sponsees ORDER BY sponsees DESC"

 sponsors = {}
 @neo.execute_query(query)["data"].each do |id, sponsees|
 	sponsors[id] = sponsees
 end
 sponsors
end
That creates a hash of sponsors with a count of how many sponsees they which I used in the following function to creates a collection of nodes:
def nodes
  query =  " START n = node(*)"
  query << " MATCH n-[r:member_of]->o"
  query << " WHERE o.name IN ['London', 'Manchester', 'Hamburg'] AND not(has(r.end_date))"
  query << " RETURN DISTINCT(n.name), ID(n)"

  sponsors_sponsee_count = load_sponsors

  nodes = Set.new
  @neo.execute_query(query)["data"].each do |n|
  	nodes << { "id" => n[1], "name" => n[0], "size" => 5 + ((sponsors_sponsee_count[n[1]] || 0) * 5) }
  end

  nodes
end
I have nodes representing people in the whole organisation so I need to filter to only find people who work for ThoughtWorks Europe since that’s where I have the sponsor data for. I add a size property here so that people who have more sponsees will be more prominent on the graph.
We then have the following function to describe the 'sponsor_of' relationships:
def edges
  query =  " START n = node(*)"
  query << " MATCH n-[r:sponsor_of]->n2"
  query << " RETURN ID(r), ID(n), ID(n2)"

  @neo.execute_query(query)["data"].collect{|n| {"id" => n[0], "source" => n[1], "target" => n[2]} }
end
I use the following code to generate the XML format I need:
xml = Builder::XmlMarkup.new(:target=>STDOUT, :indent=>2)
xml.instruct! :xml
xml.gexf 'xmlns' => "http://www.gephi.org/gexf", 'xmlns:viz' => "http://www.gephi.org/gexf/viz"  do
  xml.graph 'defaultedgetype' => "directed", 'idtype' => "string", 'type' => "static" do
    xml.nodes :count => nodes.size do
      nodes.each do |n|
        xml.node :id => n["id"],   :label => n["name"] do
          xml.tag!("viz:size",     :value => n["size"])
          xml.tag!("viz:color",    :b => 255, :g => 255, :r => 255)
          xml.tag!("viz:position", :x => rand(100), :y => rand(100))
       end
      end
    end
    xml.edges :count => edges.size do
      edges.each do |e|
        xml.edge:id => e["id"], :source => e["source"], :target => e["target"]
      end
    end
  end
end
We end up with something like the following:
<?xml version="1.0" encoding="UTF-8"?>
<gexf xmlns="http://www.gephi.org/gexf" xmlns:viz="http://www.gephi.org/gexf/viz">
  <graph defaultedgetype="directed" idtype="string" type="static">
    <nodes count="274">
      <node id="1331" label="Person 1">
        <viz:size value="5"/>
        <viz:color b="255" g="255" r="255"/>
        <viz:position x="69" y="31"/>
      </node>
    ....
    </nodes>
    <edges count="187">
      <edge id="7975" source="56" target="1374"/>
    </edges>
  </graph>
</gexf>
I set the positions of the nodes to be randomised because the gephi algorithms seem to work much better that way.
I can then create the gexf file like so:
ruby gephi_me.rb >> sponsors.gexfI loaded it into gephi and ran the Force Atlas & 'Noverlap' algorithms over the graph to make it a bit easier to visualise the data:
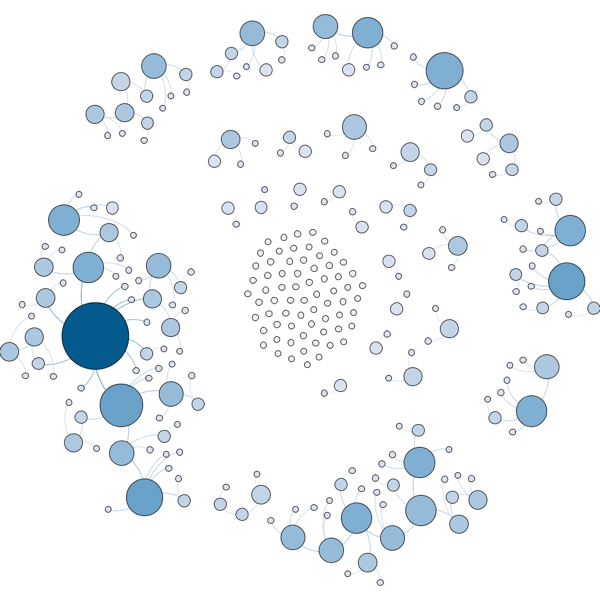
The top 4 sponsors on the graph are sponsors to 28 people between them and the next 7 cover a further 35 people.
Interestingly there’s a big group of orphans in the middle who don’t have a sponsor - initially I thought it was a bit strange that there are so many but people who have moved to the UK from another country and have a sponsor from that country would also come in this category.
I wrote the following query to help me find out who the orphans were after noticing that on the visualisation:
  query =  " START n = node(*)"
  query << " MATCH n-[r:member_of]->o, n<-[r2?:sponsor_of]-n2"
  query << " WHERE r2 is null and o.name IN ['London', 'Manchester', 'Hamburg'] AND not(has(r.end_date))"
  query << " RETURN DISTINCT(n.name), ID(n)"
I wanted to annotate the image to point out who specific people were for internal use and a few people on twitter pointed me towards skitch which made my life amazingly easy so I’d highly recommend that.
About the author
I'm currently working on short form content at ClickHouse. I publish short 5 minute videos showing how to solve data problems on YouTube @LearnDataWithMark. I previously worked on graph analytics at Neo4j, where I also co-authored the O'Reilly Graph Algorithms Book with Amy Hodler.