
A quick and dirty way of testing the performance of a service
We had a power outage in our data centre yesterday and once it had recovered Jason and I wanted to do a quick check that one of our backend services was still responding in an acceptable amount of time.
Since this particular service only serves HTTP GET requests it was reasonably easy to setup a cURL command to do this:
while true; do curl -k -s -w %{time_total} https://serviceurl/whatever/something; -o /dev/null; printf "\n"; done > service.txtThe '-w' flag is one I haven’t used before but it allows us to output a bunch of interesting things about the request.
In this case we’re only interested in the end to end time of the request/response but we could be more fine grained if we wanted to be.
We ran that for a little while and then killed it and wrote a little Ruby script to get the times in a format that would make it easy to plug into R:
# output cut for brevity
$ p File.readlines("service.txt").map { |x| x.gsub(/\n/, "").to_f }.sort
[0.042, 0.043, 0.043, 0.045, 0.046...1.083]
We then plotted a Histogram in R:
> times = c(0.042, 0.043, 0.043, 0.045, 0.046, 0.046, 0.046, 0.047, 0.047, 0.047, 0.048, 0.048, 0.048, 0.048, 0.048, 0.048, 0.048, 0.049, 0.05, 0.05, 0.05, 0.051, 0.051, 0.051, 0.051, 0.051, 0.051, 0.051, 0.051, 0.052, 0.052, 0.052, 0.053, 0.053, 0.053, 0.054, 0.054, 0.055, 0.055, 0.056, 0.056, 0.056, 0.056, 0.056, 0.056, 0.056, 0.056, 0.057, 0.057, 0.057, 0.057, 0.058, 0.059, 0.06, 0.06, 0.06, 0.061, 0.061, 0.061, 0.061, 0.061, 0.061, 0.062, 0.062, 0.063, 0.063, 0.064, 0.066, 0.066, 0.067, 0.071, 0.071, 0.072, 0.073, 0.074, 0.079, 0.081, 0.084, 0.085, 0.085, 0.091, 0.108, 0.116, 0.14, 0.182, 0.26, 0.281, 1.083)
> hist(times)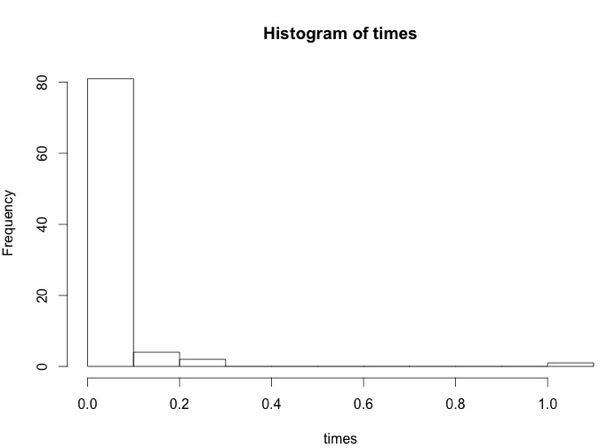
That roughly shows us that the massive majority of requests were being served in under 1/10th a second which was acceptable for this service.
We can also run a couple of other commands on the times to learn more about the distribution:
> summary(times)
   Min. 1st Qu.  Median    Mean 3rd Qu.    Max.
0.04200 0.05100 0.05600 0.07745 0.06325 1.08300
> quantile(times, 0.95)
95%
0.1316From these functions we learn that the max value is an outlier compared to the others and 95% of the requests were served in 0.13 seconds or less which was enough evidence to convince us that the service hadn’t degraded.
About the author
I'm currently working on short form content at ClickHouse. I publish short 5 minute videos showing how to solve data problems on YouTube @LearnDataWithMark. I previously worked on graph analytics at Neo4j, where I also co-authored the O'Reilly Graph Algorithms Book with Amy Hodler.