
Neo4j: The 'thinking in graphs' curve
In a couple of Neo4j talks I’ve done recently I’ve been asked how long it takes to get used to modelling data in graphs and whether I felt it’s simpler than alternative approaches.
My experience of 'thinking in graphs'™ closely mirrors what I believe is a fairly common curve when learning technologies which change the way you think:
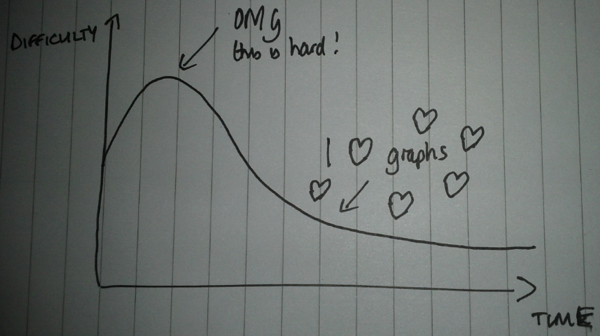
There is an initial stage where it seems really hard because it’s different to what we’re used to and at this stage we might want to go back to what we’re used to.
If we persevere, however, we will get over that hump and after that it will be difficult to imagine another way of modelling data - at least in domains where the connections between different bits of data are important.
Once we’re over the hump data modelling should seem like fun and we’ll start looking to see whether we can use graphs to solve other problems we’ve got.
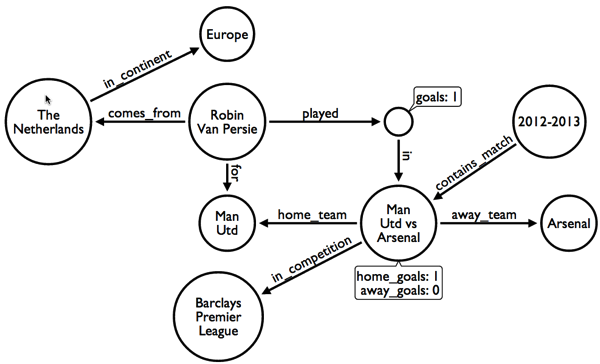
I wasn’t sure whether modelling in graphs is simpler than alternative approaches so as a thought experiment I decided to see what part of my football graph would look like if it was modelled in a relational database.
This is the graph model:
If we went for a normalised relational design it might look like this:
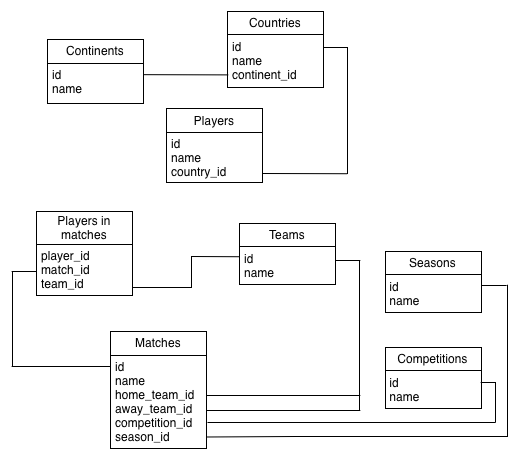
I think this is at least equal in complexity to the graph model and it wouldn’t be much fun writing queries against it as the joins pile up!
Of course this comparison is on a data set which is very graphy in nature and therefore well suited for Neo4j. There are certainly other domains where a relational approach would be much more effective.
About the author
I'm currently working on short form content at ClickHouse. I publish short 5 minute videos showing how to solve data problems on YouTube @LearnDataWithMark. I previously worked on graph analytics at Neo4j, where I also co-authored the O'Reilly Graph Algorithms Book with Amy Hodler.