
2015: A year in the life of the Neo4j London meetup group
Given we’ve only got a few more hours left of 2015 I thought it’d be fun to do a quick overview of how things have been going in the London chapter of the Neo4j meetup using Neo4j with a bit of R mixed in.
We’re going to be using the RNeo4j library to interact with the database along with a few other libraries which will help us out with different tasks:
library(RNeo4j)
library(ggplot2)
library(dplyr)
library(zoo)

graph = startGraph("http://localhost:7474/db/data/", username = "neo4j", password = "myPassword")
Let’s get to it:
Members
query = "MATCH (:Group {name: {name}})<-[membership:MEMBER_OF]-()
         RETURN membership.joined AS timestamp"

joinedDF = cypher(graph, query, name = "Neo4j - London User Group")
joinedDF$joinDate = as.Date(as.POSIXct(joinedDF$timestamp / 1000, origin="1970-01-01"))
joinedDF$joinDate = as.Date(as.POSIXct(joinedDF$timestamp / 1000, origin="1970-01-01"))

ggplot(aes(x = year, y = n, label = n),
       data = joinedDF %>% mutate(year = format(joinDate, "%Y")) %>% count(year)) +
  geom_bar(stat = "identity", fill = "Dark Blue") +
  ggtitle("Number of new members by year") +
  geom_text(vjust=-0.5)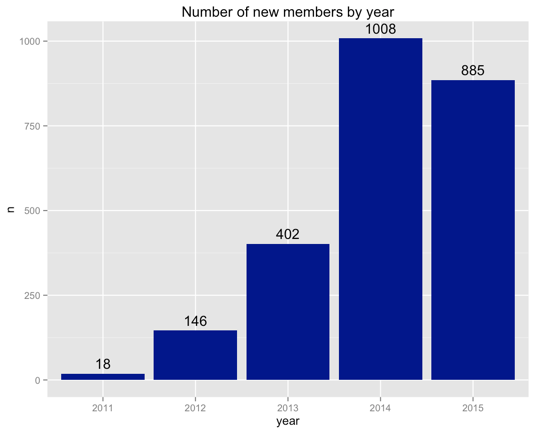
A bit down on 2014 but not too far away. We’re still attracting new people who are interested in learning about graphs. Let’s drill into those numbers a bit:
byYearMon = joinedDF %>%
  filter(format(joinDate, "%Y") == 2015) %>%
  mutate(yearmon = as.Date(as.yearmon(joinDate))) %>%
  count(yearmon)

ggplot(aes(x = yearmon, y = n, label = n), data = byYearMon) +
  geom_bar(stat = "identity", fill = "Dark Blue") +
  theme(axis.text.x = element_text(angle = 90, hjust = 1)) +
  scale_x_date(labels = date_format("%B"), breaks = "1 month") +
  ggtitle("Number of new members by month/year")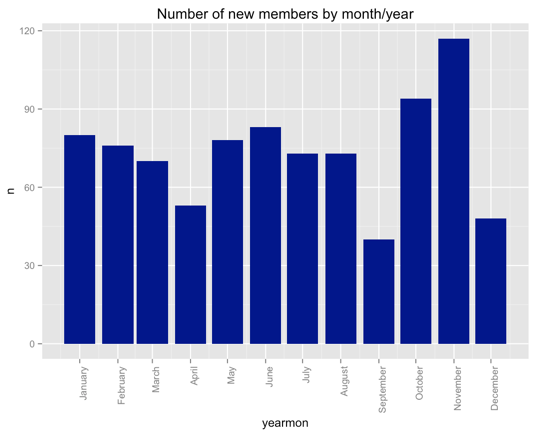
We had a bit of an end of year surge in October/November which was unexpected. December has been low in previous years, there was an April dip which I think is because we stopped doing events before Graph Connect 2015. I’m not sure about the September dip so let’s have a look:
eventsQuery = "MATCH (:Group {name: {name}})-[:HOSTED_EVENT]->(event)
               RETURN event.time + event.utcOffset AS timestamp"
eventsDF = cypher(graph, eventsQuery, name = "Neo4j - London User Group")
eventsDF$timestamp = as.Date(as.POSIXct(eventsDF$timestamp / 1000, origin="1970-01-01"))

eventsByYearMon = eventsDF %>%
  filter(format(timestamp, "%Y") == 2015) %>%
  mutate(yearmon = as.Date(as.yearmon(timestamp))) %>%
  count(yearmon)

merge(eventsByYearMon, byYearMon, by="yearmon")

      yearmon n.x n.y
1  2015-01-01   3  80
2  2015-02-01   6  76
3  2015-03-01   2  70
4  2015-04-01   2  53
5  2015-05-01   4  78
6  2015-06-01   5  83
7  2015-07-01   3  73
8  2015-08-01   5  73
9  2015-09-01   3  40
10 2015-10-01   3  94
11 2015-11-01   4 117
12 2015-12-01   3  48
At first glance there doesn’t seem to be any correlation between the number of events held and the number of new members so I think we’ll have to look for another predictor of that variable!
Events
Next let’s have a look at the events we ran in 2015. We’ll start with a quick chart showing the number of events we’ve run over the years:
ggplot(aes(x = year, y = n, label = n), data = eventsDF %>% mutate(year = format(timestamp, "%Y")) %>% count(year)) +
  geom_bar(stat = "identity", fill = "Dark Blue") +
  theme(axis.text.x = element_text(angle = 90, hjust = 1)) +
  ggtitle("Number of events")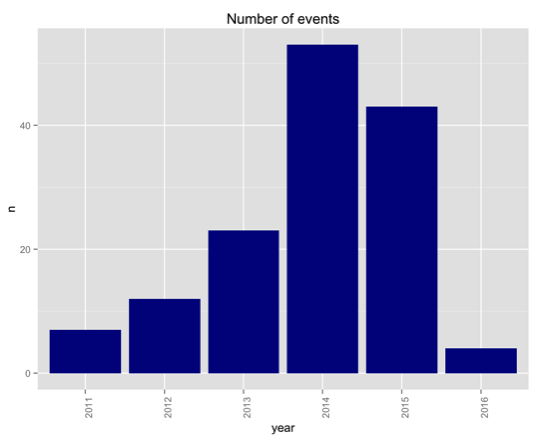
So less events than last year but how many people RSVPD 'yes' to the ones we did host?
eventsQuery = "MATCH (:Group {name: {name}})-[:HOSTED_EVENT]->(event)<-[:RSVPD {response: 'yes'}]-()
               WHERE event.time + event.utcOffset < timestamp()
               WITH event, COUNT(*) AS rsvps
               RETURN event.time + event.utcOffset AS timestamp, rsvps"
eventsDF = cypher(graph, eventsQuery, name = "Neo4j - London User Group")
eventsDF$timestamp = as.Date(as.POSIXct(eventsDF$timestamp / 1000, origin="1970-01-01"))

ggplot(aes(x = year, y = rsvps),
       data = eventsDF %>% mutate(year = format(timestamp, "%Y")) %>% group_by(year) %>% summarise(rsvps= sum(rsvps)) ) +
  geom_bar(stat = "identity", fill = "Dark Blue") +
  theme(axis.text.x = element_text(angle = 90, hjust = 1)) +
  ggtitle("Number of attendees")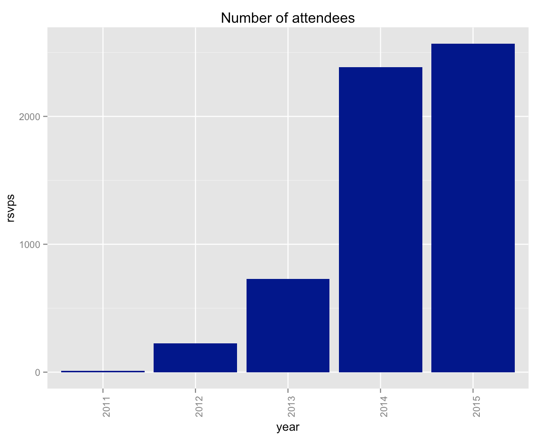
Slightly more 'yes' RSVPs than last year. Now let’s drill into the repeat events we ran this year:
eventsQuery = "MATCH (:Group {name: {name}})-[:HOSTED_EVENT]->(event)
               WHERE {startYear} <= (event.time + event.utcOffset) < {endYear}
               RETURN event.name AS event, COUNT(*) AS times
               ORDER BY times DESC"
eventsDF = cypher(graph, eventsQuery, name = "Neo4j - London User Group",
                  startYear  = as.numeric(as.POSIXct("2015-01-01", format="%Y-%m-%d")) * 1000,
                  endYear = as.numeric(as.POSIXct("2015-12-31", format="%Y-%m-%d")) * 1000)
eventsDF %>% filter(times > 1)

                                                       event times
1                      Relational to graph: A worked example     7
2                                            Intro to Graphs     6
3                          Graph Modelling - Do's and Don'ts     5
4          Hands On Intro to Cypher - Neo4j's Query Language     3
5 Build your own recommendation engine with Neo4j in an hour     2
6                                Fraud Detection using Neo4j     2
I thought we’d run 'Intro to Graphs' most often but the data doesn’t lie - it’s all about relational to graph. And which were the most popular repeat events in terms of 'yes' RSVPs?
eventsQuery = "MATCH (:Group {name: {name}})-[:HOSTED_EVENT]->(event)
               WHERE {startYear} <= (event.time + event.utcOffset) < {endYear}
               MATCH (event)<-[:RSVPD {response: 'yes'}]-()
               WITH event, COUNT(*) AS yesRSVPs
               WITH event.name AS event, COUNT(*) AS times, SUM(yesRSVPs) AS rsvps
               RETURN event, times, rsvps, rsvps / times AS rsvpsPerEvent
               ORDER BY rsvpsPerEvent DESC"
eventsDF = cypher(graph, eventsQuery, name = "Neo4j - London User Group",
                  startYear  = as.numeric(as.POSIXct("2015-01-01", format="%Y-%m-%d")) * 1000,
                  endYear = as.numeric(as.POSIXct("2015-12-31", format="%Y-%m-%d")) * 1000)
eventsDF %>% filter(times > 1)

                                                       event times rsvps rsvpsPerEvent
1                                Fraud Detection using Neo4j     2   150            75
2                                            Intro to Graphs     6   352            58
3                          Graph Modelling - Do's and Don'ts     5   281            56
4                      Relational to graph: A worked example     7   367            52
5 Build your own recommendation engine with Neo4j in an hour     2    85            42
6          Hands On Intro to Cypher - Neo4j's Query Language     3   104            34
It looks like fraud is a popular topic although we’ve only run it twice so perhaps best not to read too much into that. We’re running that one again in a couple of weeks if you’re interested.
Ignoring repeat events let’s see which event drew the biggest crowd:
eventsQuery = "MATCH (:Group {name: {name}})-[:HOSTED_EVENT]->(event)
               WHERE {startYear} <= (event.time + event.utcOffset) < {endYear}
               MATCH (event)<-[:RSVPD {response: 'yes'}]-()
               WITH event.id AS id, event.name AS event, COUNT(*) AS rsvps
               RETURN event, rsvps
               ORDER BY rsvps DESC"
eventsDF = cypher(graph, eventsQuery, name = "Neo4j - London User Group",
                  startYear  = as.numeric(as.POSIXct("2015-01-01", format="%Y-%m-%d")) * 1000,
                  endYear = as.numeric(as.POSIXct("2015-12-31", format="%Y-%m-%d")) * 1000)
eventsDF %>% head(5)

                                                                         event rsvps
1 Neo4j Full Stack Applications + Python, R and Neo4j - The Data Science Stack   133
2                          Modelling a recommendation engine: A worked example   118
3                    Building a repository of biomedical ontologies with Neo4j   107
4                     GraphHack @ Graph Connect: The night before Election Day    91
5                                        Bootstrapping a Recommendation Engine    88
A double header featuring Nicole White and Matt Wright proved to be the most popular event of the year and in fact the most popular in terms of 'yes' RSVPs so far:
eventsQuery = "MATCH (:Group {name: {name}})-[:HOSTED_EVENT]->(event)<-[:RSVPD {response: 'yes'}]-()
               WITH event, COUNT(*) AS rsvps
               RETURN event.name AS event, event.time + event.utcOffset AS time, rsvps
               ORDER BY rsvps DESC"
eventsDF = cypher(graph, eventsQuery, name = "Neo4j - London User Group")
eventsDF$time = as.Date(as.POSIXct(eventsDF$time / 1000, origin="1970-01-01"))
eventsDF %>% mutate(year = format(time, "%Y")) %>% dplyr::select(-time) %>% head(10)

                                                                          event rsvps year
1  Neo4j Full Stack Applications + Python, R and Neo4j - The Data Science Stack   133 2015
2                           Modelling a recommendation engine: A worked example   118 2015
3                     Building a repository of biomedical ontologies with Neo4j   107 2015
4                                                    Real world Neo4j use cases    98 2014
5                                                           The transport graph    94 2014
6                                                     The Visualisation Special    93 2014
7                  Impossible is Nothing by Jim Webber, Neo4j's Chief Scientist    93 2014
8                      GraphHack @ Graph Connect: The night before Election Day    91 2015
9                                         Bootstrapping a Recommendation Engine    88 2015
10                                    Scraping and Graphing the Apple app store    88 2015
3 of the top 4 belong to 2015 and 6 of the top 10. Let’s see what 2016 has in store.
Thanks to everyone who’s come along to one of our meetups and Happy New Year!
About the author
I'm currently working on short form content at ClickHouse. I publish short 5 minute videos showing how to solve data problems on YouTube @LearnDataWithMark. I previously worked on graph analytics at Neo4j, where I also co-authored the O'Reilly Graph Algorithms Book with Amy Hodler.