
Neo4j 2.1.0-M01: LOAD CSV with Rik Van Bruggen's Tube Graph
Last week we released the first milestone of Neo4j 2.1.0 and one its features is a new function in cypher - LOAD CSV - which aims to make it easier to get data into Neo4j.
I thought I’d give it a try to import the London tube graph - something that my colleague Rik wrote about a few months ago.
I’m using the same data set as Rik but I had to tweak it a bit as there were naming differences when describing the connection from Kennington to Waterloo and Kennington to Oval. My updated version of the dataset is on github.
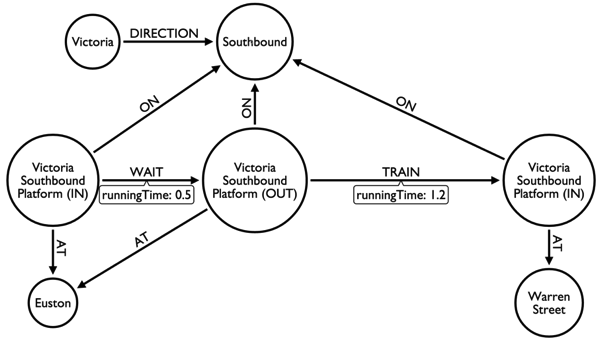
With the help of Alistair we now have a variation on the original which takes into account the various platforms at stations and the waiting time of a train on the platform. This will also enable us to add in things like getting from the ticket hall to the various platforms more easily.
The model looks like this:
Now we need to create a graph and the first step is to put an index on station name as we’ll be looking that up quite frequently in the queries that follow:
CREATE INDEX on :Station(stationName)Now that’s in place we can make use of LOAD CSV. The data is very de-normalised which works out quite nicely for us and we end up with the following script:
LOAD CSV FROM "file:/Users/markhneedham/code/tube/runtimes.csv" AS csvLine
WITH csvLine[0] AS lineName,
     csvLine[1] AS direction,
     csvLine[2] AS startStationName,
     csvLine[3] AS destinationStationName,
     toFloat(csvLine[4]) AS distance,
     toFloat(csvLine[5]) AS runningTime

MERGE (start:Station { stationName: startStationName})
MERGE (destination:Station { stationName: destinationStationName})
MERGE (line:Line { lineName: lineName})
MERGE (line) - [:DIRECTION] -> (dir:Direction { direction: direction})
CREATE (inPlatform:InPlatform {name: "In: " + destinationStationName + " " + lineName + " " + direction})
CREATE (outPlatform:OutPlatform {name: "Out: " + startStationName + " " + lineName + " " + direction})
CREATE (inPlatform) - [:AT] -> (destination)
CREATE (outPlatform) - [:AT] -> (start)
CREATE (inPlatform) - [:ON] -> (dir)
CREATE (outPlatform) - [:ON] -> (dir)
CREATE (outPlatform) - [r:TRAIN {distance: distance, runningTime: runningTime}] -> (inPlatform)
This file doesn’t contain any headers so we’ll simulate them by using a WITH clause so that we don’t have index lookups all over the place. In this case we’re pointing to a file on the local file system but we could choose to point to a CSV file on the web if we wanted to.
Since stations, lines and directions appear frequently we’ll use MERGE to ensure they don’t get duplicated.
After that we have a post processing step to connect the 'in' and 'out' platforms shown in the diagram.
MATCH (station:Station) <-[:AT]- (platformIn:InPlatform),
      (station:Station) <-[:AT]- (platformOut:OutPlatform),
      (direction:Direction) <-[:ON]- (platformIn:InPlatform),
      (direction:Direction) <-[:ON]- (platformOut:OutPlatform)
CREATE (platformIn) -[:WAIT {runningTime: 0.5}]-> (platformOut)
After running a few queries on the graph I realised that it wasn’t possible to combine some journies through Kennington and Euston so I had to add some relationships in there as well:
// link the Euston stations
MATCH (euston:Station {stationName: "EUSTON"})<-[:AT]-(eustonIn:InPlatform)
MATCH (eustonCx:Station {stationName: "EUSTON (CX)"})<-[:AT]-(eustonCxIn:InPlatform)
MATCH (eustonCity:Station {stationName: "EUSTON (CITY)"})<-[:AT]-(eustonCityIn:InPlatform)

CREATE UNIQUE (eustonIn)-[:WAIT {runningTime: 0.0}]->(eustonCxIn)
CREATE UNIQUE (eustonIn)-[:WAIT {runningTime: 0.0}]->(eustonCityIn)
CREATE UNIQUE (eustonCxIn)-[:WAIT {runningTime: 0.0}]->(eustonCityIn)

// link the Kennington stations
MATCH (kenningtonCx:Station {stationName: "KENNINGTON (CX)"})<-[:AT]-(kenningtonCxIn:InPlatform)
MATCH (kenningtonCity:Station {stationName: "KENNINGTON (CITY)"})<-[:AT]-(kenningtonCityIn:InPlatform)

CREATE UNIQUE (kenningtonCxIn)-[:WAIT {runningTime: 0.0}]->(kenningtonCityIn)
I’ve been playing around with the A* algorithm to find the quickest route between stations based on the distances between stations.
The next step is to put a timetable graph alongside this so we can do quickest routes at certain parts of the day and the next step after that will be to take delays into account.
If you’ve got some data you want to get into the graph give LOAD CSV a try and let us know how you get on, the cypher team are keen to get feedback on this.
About the author
I'm currently working on short form content at ClickHouse. I publish short 5 minute videos showing how to solve data problems on YouTube @LearnDataWithMark. I previously worked on graph analytics at Neo4j, where I also co-authored the O'Reilly Graph Algorithms Book with Amy Hodler.