
R: Linear models with the lm function, NA values and Collinearity
In my continued playing around with R I’ve sometimes noticed 'NA' values in the linear regression models I created but hadn’t really thought about what that meant.
On the advice of Peter Huber I recently started working my way through Coursera’s Regression Models which has a whole slide explaining its meaning:
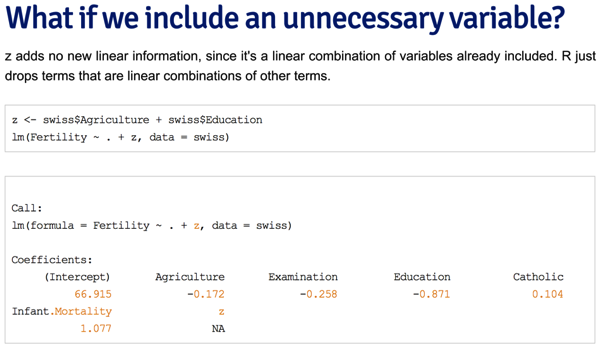
So in this case 'z' doesn’t help us in predicting Fertility since it doesn’t give us any more information that we can’t already get from 'Agriculture' and 'Education'.
Although in this case we know why 'z' doesn’t have a coefficient sometimes it may not be clear which other variable the NA one is highly correlated with.
Multicollinearity (also collinearity) is a statistical phenomenon in which two or more predictor variables in a multiple regression model are highly correlated, meaning that one can be linearly predicted from the others with a non-trivial degree of accuracy.
In that situation we can make use of the http://stat.ethz.ch/R-manual/R-devel/library/stats/html/alias.html function to explain the collinearity as suggested in this StackOverflow post:
library(datasets); data(swiss); require(stats); require(graphics)
z <- swiss$Agriculture + swiss$Education
fit = lm(Fertility ~ . + z, data = swiss)
> alias(fit)
Model :
Fertility ~ Agriculture + Examination + Education + Catholic +
Infant.Mortality + z
Complete :
(Intercept) Agriculture Examination Education Catholic Infant.Mortality
z 0 1 0 1 0 0In this case we can see that 'z' is highly correlated with both Agriculture and Education which makes sense given its the sum of those two variables.
When we notice that there’s an NA coefficient in our model we can choose to exclude that variable and the model will still have the same coefficients as before:
> require(dplyr)
> summary(lm(Fertility ~ . + z, data = swiss))$coefficients
                   Estimate  Std. Error   t value     Pr(>|t|)
(Intercept)      66.9151817 10.70603759  6.250229 1.906051e-07
Agriculture      -0.1721140  0.07030392 -2.448142 1.872715e-02
Examination      -0.2580082  0.25387820 -1.016268 3.154617e-01
Education        -0.8709401  0.18302860 -4.758492 2.430605e-05
Catholic          0.1041153  0.03525785  2.952969 5.190079e-03
Infant.Mortality  1.0770481  0.38171965  2.821568 7.335715e-03
> summary(lm(Fertility ~ ., data = swiss))$coefficients
                   Estimate  Std. Error   t value     Pr(>|t|)
(Intercept)      66.9151817 10.70603759  6.250229 1.906051e-07
Agriculture      -0.1721140  0.07030392 -2.448142 1.872715e-02
Examination      -0.2580082  0.25387820 -1.016268 3.154617e-01
Education        -0.8709401  0.18302860 -4.758492 2.430605e-05
Catholic          0.1041153  0.03525785  2.952969 5.190079e-03
Infant.Mortality  1.0770481  0.38171965  2.821568 7.335715e-03
If we call alias now we won’t see any output:
> alias(lm(Fertility ~ ., data = swiss))
Model :
Fertility ~ Agriculture + Examination + Education + Catholic +
Infant.MortalityAbout the author
I'm currently working on short form content at ClickHouse. I publish short 5 minute videos showing how to solve data problems on YouTube @LearnDataWithMark. I previously worked on graph analytics at Neo4j, where I also co-authored the O'Reilly Graph Algorithms Book with Amy Hodler.