
Python: Altair - Setting the range of Date values for an axis
In my continued experiments with the Altair visualisation library, I wanted to set a custom range of data values on the x axis of a chart. In this blog post we’ll learn how to do that.
We’ll start where we left off in the last blog post, with the following code that renders a scatterplot containing the chart position of a song on a certain date:
import altair as alt
import pandas as pd
import datetime

df = pd.DataFrame( [
    {"position": 40, "date": datetime.date(2019,9,5)},
    {"position": 31, "date": datetime.date(2019,9,12)},
    {"position": 19, "date": datetime.date(2019,9,19)},
    {"position": 14, "date": datetime.date(2019,9,26)},
    {"position": 7, "date": datetime.date(2019,10,3)},
    {"position": 1, "date": datetime.date(2019,10,10)},
    {"position": 1, "date": datetime.date(2019,10,17)},
    {"position": 1, "date": datetime.date(2019,10,24)},
])
df["date"] = pd.to_datetime(df["date"])

chart = alt.Chart(df).mark_point(color="red").encode(
    x='date',
    y='position')
chart.save("chart.html")
If we run this script, we’ll have the following chart in chart.html:
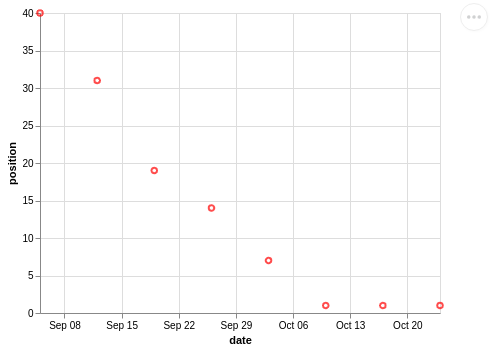
At the moment the x axis of our chart covers the range of dates included in our DataFrame. I wanted to have that axis start from 1st January 2019 and end on 31st December 2019, and came across a GitHub issue describing how to do this.
One way to do this is to create a Pandas index and then define a custom domain for the scale of the x axis.
The code below does this:
domain_pd = pd.to_datetime(['2019-01-01', '2019-12-31']).astype(int) / 10 ** 6
chart = alt.Chart(df).mark_point(color="red").encode(
    x=alt.X('date:T', timeUnit='yearmonthdate', scale=alt.Scale(domain=list(domain_pd))),
    y='position')
chart.save("chart.html")
If we run this script, we’ll have the following chart in chart.html:
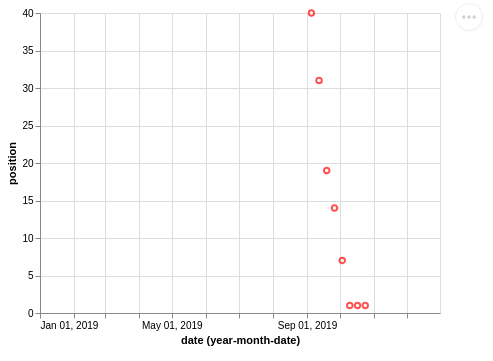
Another, simpler way, is to pass in a list containing the start and end dates, as shown below:
domain = ["2019-01-01", "2019-12-31"]
chart = alt.Chart(df).mark_point(color="red").encode(
    x=alt.X('date:T', timeUnit='yearmonthdate', scale=alt.Scale(domain=domain)),
    y='position')
chart.save("chart.html")
All the code from this blog post is available in a GitHub Gist.
About the author
I'm currently working on short form content at ClickHouse. I publish short 5 minute videos showing how to solve data problems on YouTube @LearnDataWithMark. I previously worked on graph analytics at Neo4j, where I also co-authored the O'Reilly Graph Algorithms Book with Amy Hodler.