
Vaccinating England: The Data (cleanup)
Over the last 13 months I’ve spent countless hours looking at dashboards that showed Coronavirus infection rates, death rates, and numbers of people vaccinated. The UK government host a dashboard at coronavirus.data.gov.uk, which contains charts and tables showing all of the above.
One thing I haven’t been able to find, however, is a drill down of vaccinations by local area and age group. So I’m going to try to build my own!

This is the first in a series of blog posts showing how to do that, in this post we’ll find the data and get it into a format that’s easier to process.
The Data
First, we need to find the data! I haven’t found anywhere that contains the data for the whole of the United Kingdom, but Public Health England do post the data about vaccinations every Thursday.
This page contains various PDFs and spreadsheets and the 'Weekly data' spreadsheet is the one that we want. This spreadsheet contains data on vaccinations by local area and age group, as well as the populations of those areas and age groups.
Reading Excel Sheets with Pandas
We’re going to use Python’s Pandas library to read the data from the spreadsheet, but we’ll also need to install some other libraries that deal with reading xlsx files:
pip install numpy pandas xlrd openpyxlOnce we’ve done that, let’s import pandas and numpy:
import pandas as pd
import numpy as np
Vaccinations
We’re going to start by extracting vaccination data.
This is stored in the LTLA sheet:
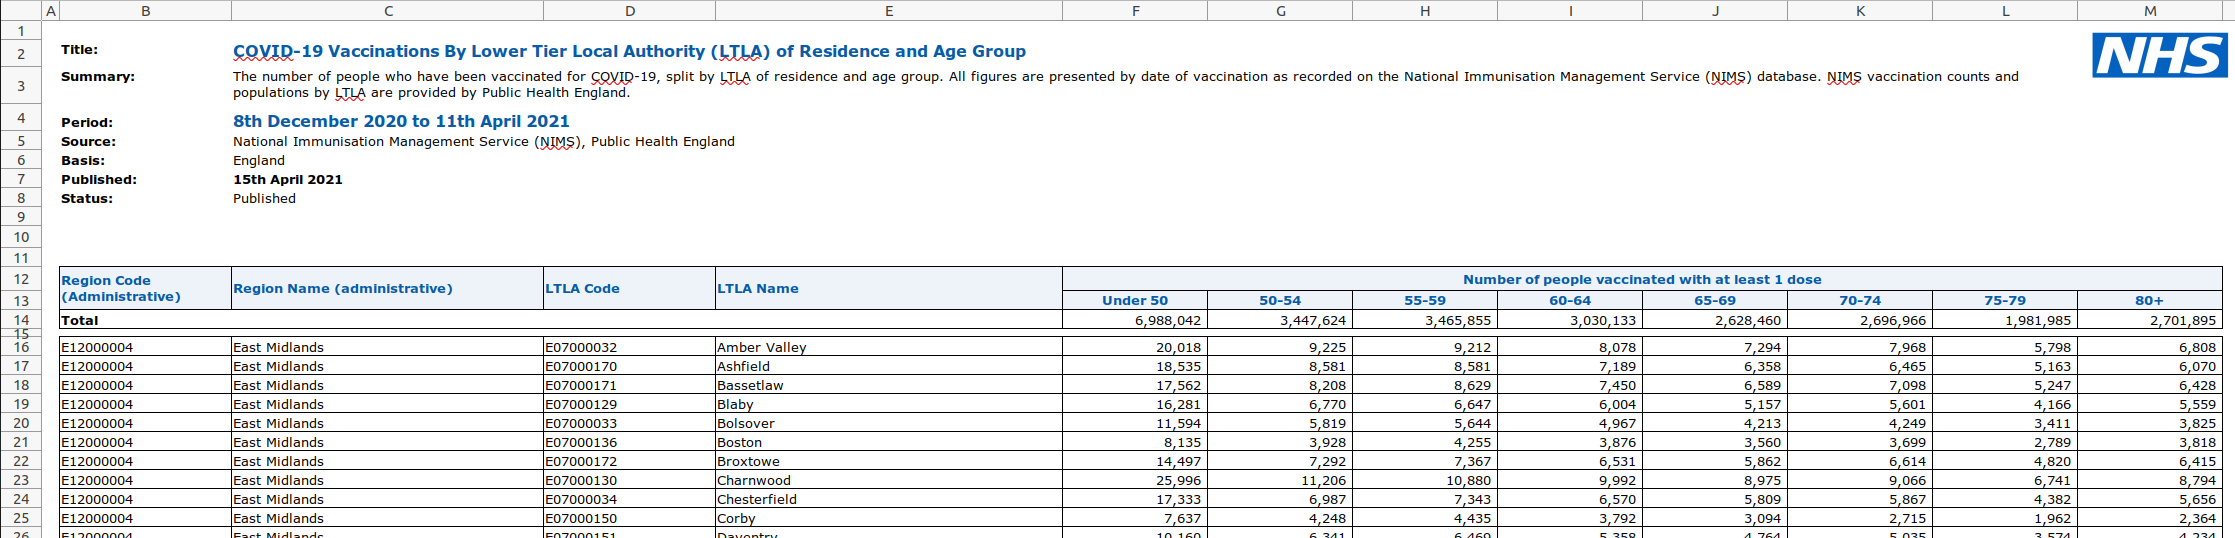
From visually inspecting the spreadsheet, we can see that columns B to M contain the data we’re interested in.
We can extract just those columns by using the usecols parameter, as shown below:
spreadsheet = "data/COVID-19-weekly-announced-vaccinations-15-April-2021.xlsx"
vaccinations = pd.read_excel(spreadsheet, "LTLA", usecols="B:M")
vaccinations.head()| Unnamed: 1 | Unnamed: 2 | Unnamed: 3 | Unnamed: 4 | Unnamed: 5 | Unnamed: 6 | Unnamed: 7 | Unnamed: 8 | Unnamed: 9 | Unnamed: 10 | Unnamed: 11 | Unnamed: 12 |
|---|---|---|---|---|---|---|---|---|---|---|---|
Title: |
COVID-19 Vaccinations By Lower Tier Local Authority (LTLA) of Residence and Age Group |
nan |
nan |
nan |
nan |
nan |
nan |
nan |
nan |
nan |
nan |
Summary: |
The number of people who have been vaccinated for COVID-19, split by LTLA of residence and age group. All figures are presented by date of vaccination as recorded on the National Immunisation Management Service (NIMS) database. NIMS vaccination counts and populations by LTLA are provided by Public Health England. |
nan |
nan |
nan |
nan |
nan |
nan |
nan |
nan |
nan |
nan |
Period: |
8th December 2020 to 11th April 2021 |
nan |
nan |
nan |
nan |
nan |
nan |
nan |
nan |
nan |
nan |
Source: |
National Immunisation Management Service (NIMS), Public Health England |
nan |
nan |
nan |
nan |
nan |
nan |
nan |
nan |
nan |
nan |
Basis: |
England |
nan |
nan |
nan |
nan |
nan |
nan |
nan |
nan |
nan |
nan |
We clearly still have some cleanup work to do. We already filtered on columns when loading the sheet, so let’s now select just the rows that we need:
spreadsheet = "data/COVID-19-weekly-announced-vaccinations-15-April-2021.xlsx"
vaccinations = pd.read_excel(spreadsheet, "LTLA", usecols="B:M")
vaccinations = vaccinations.loc[14:327,]| Unnamed: 1 | Unnamed: 2 | Unnamed: 3 | Unnamed: 4 | Unnamed: 5 | Unnamed: 6 | Unnamed: 7 | Unnamed: 8 | Unnamed: 9 | Unnamed: 10 | Unnamed: 11 | Unnamed: 12 |
|---|---|---|---|---|---|---|---|---|---|---|---|
E12000004 |
East Midlands |
E07000032 |
Amber Valley |
20018 |
9225 |
9212 |
8078 |
7294 |
7968 |
5798 |
6808 |
E12000004 |
East Midlands |
E07000170 |
Ashfield |
18535 |
8581 |
8581 |
7189 |
6358 |
6465 |
5163 |
6070 |
E12000004 |
East Midlands |
E07000171 |
Bassetlaw |
17562 |
8208 |
8629 |
7450 |
6589 |
7098 |
5247 |
6428 |
E12000004 |
East Midlands |
E07000129 |
Blaby |
16281 |
6770 |
6647 |
6004 |
5157 |
5601 |
4166 |
5559 |
E12000004 |
East Midlands |
E07000033 |
Bolsover |
11594 |
5819 |
5644 |
4967 |
4213 |
4249 |
3411 |
3825 |
That’s looking better already, but those column names aren’t great. Let’s extract those and set them on our DataFrame:
spreadsheet = "data/COVID-19-weekly-announced-vaccinations-15-April-2021.xlsx"
vaccinations = pd.read_excel(spreadsheet, "LTLA", usecols="B:M")
columns = np.concatenate(
    (vaccinations.loc[10,:][:4].values, vaccinations.loc[11,:][4:].values), axis=None)
vaccinations = vaccinations.loc[14:327,]
vaccinations.columns = columns| Region Code (Administrative) | Region Name (administrative) | LTLA Code | LTLA Name | Under 50 | 50-54 | 55-59 | 60-64 | 65-69 | 70-74 | 75-79 | 80+ |
|---|---|---|---|---|---|---|---|---|---|---|---|
E12000004 |
East Midlands |
E07000032 |
Amber Valley |
20018 |
9225 |
9212 |
8078 |
7294 |
7968 |
5798 |
6808 |
E12000004 |
East Midlands |
E07000170 |
Ashfield |
18535 |
8581 |
8581 |
7189 |
6358 |
6465 |
5163 |
6070 |
E12000004 |
East Midlands |
E07000171 |
Bassetlaw |
17562 |
8208 |
8629 |
7450 |
6589 |
7098 |
5247 |
6428 |
E12000004 |
East Midlands |
E07000129 |
Blaby |
16281 |
6770 |
6647 |
6004 |
5157 |
5601 |
4166 |
5559 |
E12000004 |
East Midlands |
E07000033 |
Bolsover |
11594 |
5819 |
5644 |
4967 |
4213 |
4249 |
3411 |
3825 |
This is all looking good, but there’s one final bit of cleanup that we need to do.
The dtypes function returns the data type of each column.
Let’s check what it returns for our DataFrame:
vaccinations.dtypesRegion Code (Administrative) object
Region Name (administrative) object
LTLA Code object
LTLA Name object
Under 50 object
50-54 object
55-59 object
60-64 object
65-69 object
70-74 object
75-79 object
80+ object
dtype: objectHmmm, every column is an object, when we know that some columns only have numeric values.
We can fix column types by calling the convert_dtypes function:
vaccinations.convert_dtypes().dtypesRegion Code (Administrative) string
Region Name (administrative) string
LTLA Code string
LTLA Name string
Under 50 Int64
50-54 Int64
55-59 Int64
60-64 Int64
65-69 Int64
70-74 Int64
75-79 Int64
80+ Int64
dtype: objectLooks good. Let’s now wrap all of that code into a function:
def vaccinations_dataframe(spreadsheet):
    vaccinations = pd.read_excel(spreadsheet, "LTLA", usecols="B:M")
    columns = np.concatenate(
        (vaccinations.loc[10,:][:4].values, vaccinations.loc[11,:][4:].values), axis=None)
    vaccinations = vaccinations.loc[14:327,]
    vaccinations.columns = columns
    vaccinations = vaccinations.convert_dtypes()
    return vaccinations
spreadsheet = "data/COVID-19-weekly-announced-vaccinations-15-April-2021.xlsx"
vaccinations = vaccinations_dataframe(spreadsheet)Population
Now we’ll do the same for each Local Tier Local Authority’s population, which we can find in the Population estimates (NIMS) sheet.
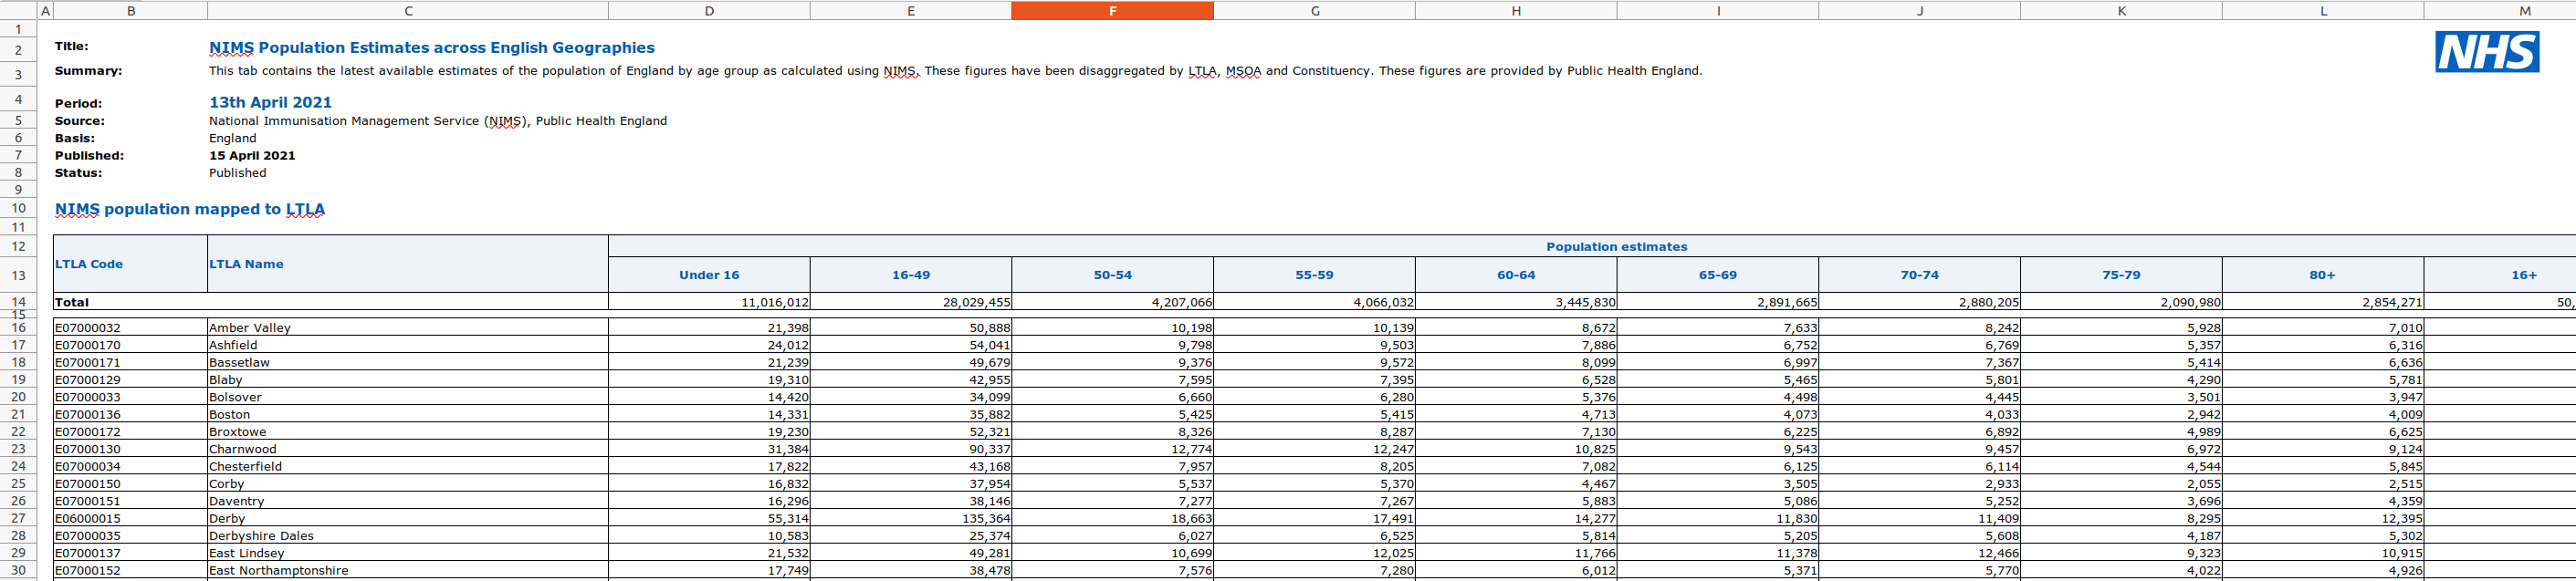
We’ll skip straight to the final function for creating the DataFrame:
def population_dataframe(spreadsheet):
    population = pd.read_excel(spreadsheet, "Population estimates (NIMS)", usecols="B:L")
    population_columns = np.concatenate(
        (population.loc[10,:][:2], population.loc[11, :][2:]), axis=None)
    population = population.loc[14:327,]
    population.columns = population_columns
    population.insert(
        loc=2,
        column="Under 50",
        value=population["Under 16"] + population["16-49"])
    population = population.drop(["Under 16", "16-49"], axis=1)
    population = population.convert_dtypes()
    return population
One extra thing we had to do was add the Under 50 column, since that didn’t exist in the spreadsheet.
We need that column to exist so that we can directly map the population with the number of people vaccinated per age group per area.
Now let’s use that function to extract the population for each area:
spreadsheet = "data/COVID-19-weekly-announced-vaccinations-15-April-2021.xlsx"
population = population_dataframe(spreadsheet)| LTLA Code | LTLA Name | Under 50 | 50-54 | 55-59 | 60-64 | 65-69 | 70-74 | 75-79 | 80+ |
|---|---|---|---|---|---|---|---|---|---|
E07000032 |
Amber Valley |
72286 |
10198 |
10139 |
8672 |
7633 |
8242 |
5928 |
7010 |
E07000170 |
Ashfield |
78053 |
9798 |
9503 |
7886 |
6752 |
6769 |
5357 |
6316 |
E07000171 |
Bassetlaw |
70918 |
9376 |
9572 |
8099 |
6997 |
7367 |
5414 |
6636 |
E07000129 |
Blaby |
62265 |
7595 |
7395 |
6528 |
5465 |
5801 |
4290 |
5781 |
E07000033 |
Bolsover |
48519 |
6660 |
6280 |
5376 |
4498 |
4445 |
3501 |
3947 |
We’ve now got DataFrames that contain vaccination and population data. Next we’re going to compute the vaccination rate per age group per area.
Combining Vaccinations and Populations
We can compute the vaccination rate by dividing the non string columns in vaccinations by the non string columns in population and then multiplying by 100.
We can see how to do this in the following code:
vaccination_rates = (vaccinations.select_dtypes(exclude='string')
.div(population.select_dtypes(exclude='string')) * 100)| Under 50 | 50-54 | 55-59 | 60-64 | 65-69 | 70-74 | 75-79 | 80+ |
|---|---|---|---|---|---|---|---|
27.6928 |
90.4589 |
90.8571 |
93.1504 |
95.5588 |
96.6756 |
97.807 |
97.1184 |
23.7467 |
87.5791 |
90.2978 |
91.1616 |
94.1647 |
95.5089 |
96.3786 |
96.1051 |
24.7638 |
87.5427 |
90.1483 |
91.9867 |
94.1689 |
96.3486 |
96.9154 |
96.8656 |
26.1479 |
89.1376 |
89.8851 |
91.973 |
94.3641 |
96.5523 |
97.1096 |
96.1598 |
23.8958 |
87.3724 |
89.8726 |
92.3921 |
93.6639 |
95.5906 |
97.4293 |
96.909 |
That looks good, but we’ve lost the area names, which we can get back by calling the combine_first function:
vaccination_rates = (
    (vaccinations.select_dtypes(exclude='string')
                 .div(population.select_dtypes(exclude='string')) * 100)
                 .combine_first(vaccinations)[vaccinations.columns])
vaccination_rates = vaccination_rates.convert_dtypes()| Region Code (Administrative) | Region Name (administrative) | LTLA Code | LTLA Name | Under 50 | 50-54 | 55-59 | 60-64 | 65-69 | 70-74 | 75-79 | 80+ |
|---|---|---|---|---|---|---|---|---|---|---|---|
E12000004 |
East Midlands |
E07000032 |
Amber Valley |
27.6928 |
90.4589 |
90.8571 |
93.1504 |
95.5588 |
96.6756 |
97.807 |
97.1184 |
E12000004 |
East Midlands |
E07000170 |
Ashfield |
23.7467 |
87.5791 |
90.2978 |
91.1616 |
94.1647 |
95.5089 |
96.3786 |
96.1051 |
E12000004 |
East Midlands |
E07000171 |
Bassetlaw |
24.7638 |
87.5427 |
90.1483 |
91.9867 |
94.1689 |
96.3486 |
96.9154 |
96.8656 |
E12000004 |
East Midlands |
E07000129 |
Blaby |
26.1479 |
89.1376 |
89.8851 |
91.973 |
94.3641 |
96.5523 |
97.1096 |
96.1598 |
E12000004 |
East Midlands |
E07000033 |
Bolsover |
23.8958 |
87.3724 |
89.8726 |
92.3921 |
93.6639 |
95.5906 |
97.4293 |
96.909 |
Exploring vaccination rates
Now that we’ve compute vaccination rates, let’s do a bit of exploration of the data.
We can find the maximum rates in each age group using the max function:
vaccination_rates.max()Region Code (Administrative) E12000009
Region Name (administrative) Yorkshire and The Humber
LTLA Code E09000033
LTLA Name York
Under 50 39.916551
50-54 91.650635
55-59 93.316424
60-64 94.840627
65-69 96.086819
70-74 99.305556
75-79 98.061389
80+ 99.386503
dtype: objectWe can ignore the values for the string columns, they don’t really mean anything. But if we look at the age categories, we can see that in one area 99.38% of over 80s have received one doses of the vaccine and the best area for under 50s has vaccinated almost 40% of that cohort.
We can find out which areas those are by sorting on the appropriate column. For example, these are the top areas for vaccinating Under 50s:
vaccination_rates.sort_values(["Under 50"], ascending=False).head()| Region Code (Administrative) | Region Name (administrative) | LTLA Code | LTLA Name | Under 50 | 50-54 | 55-59 | 60-64 | 65-69 | 70-74 | 75-79 | 80+ |
|---|---|---|---|---|---|---|---|---|---|---|---|
E12000009 |
South West |
E06000053 |
Isles of Scilly |
39.9166 |
89.8734 |
89.4444 |
91.1765 |
95.2381 |
99.3056 |
95.4545 |
99.3865 |
E12000008 |
South East |
E07000090 |
Havant |
28.4815 |
89.6867 |
91.423 |
93.2137 |
94.7948 |
95.7627 |
96.7189 |
96.7105 |
E12000004 |
East Midlands |
E07000034 |
Chesterfield |
28.4194 |
87.8095 |
89.4942 |
92.7704 |
94.8408 |
95.9601 |
96.4349 |
96.7665 |
E12000004 |
East Midlands |
E07000032 |
Amber Valley |
27.6928 |
90.4589 |
90.8571 |
93.1504 |
95.5588 |
96.6756 |
97.807 |
97.1184 |
E12000002 |
North West |
E07000128 |
Wyre |
27.56 |
87.7091 |
89.6141 |
92.7322 |
94.5789 |
95.7072 |
96.8809 |
96.7518 |
We could also group by Region Name and compute the average vaccination rate per age group:
average_rates = vaccination_rates.groupby(["Region Name (administrative)"]).mean()
average_rates.insert(0, "Region", list(average_rates.index))| Region | Under 50 | 50-54 | 55-59 | 60-64 | 65-69 | 70-74 | 75-79 | 80+ |
|---|---|---|---|---|---|---|---|---|
East Midlands |
21.3713 |
86.2392 |
88.4962 |
90.6407 |
93.2752 |
95.3722 |
96.3283 |
96.1347 |
East of England |
18.4956 |
85.1457 |
87.6499 |
89.4512 |
91.7769 |
94.2033 |
95.3887 |
95.6347 |
London |
14.4234 |
69.3903 |
73.0272 |
76.6469 |
80.2523 |
83.9104 |
85.1132 |
84.9085 |
North East |
18.7766 |
84.5177 |
88.4894 |
91.2096 |
93.7479 |
95.6958 |
96.8194 |
96.4659 |
North West |
19.751 |
83.3976 |
86.5955 |
89.3941 |
91.9802 |
94.3731 |
95.5474 |
95.4938 |
South East |
18.0919 |
85.6189 |
87.8544 |
89.6232 |
91.963 |
94.2038 |
95.2525 |
95.4839 |
South West |
19.7912 |
87.5552 |
89.477 |
90.7873 |
93.1417 |
95.1491 |
96.0111 |
96.4188 |
West Midlands |
20.426 |
85.6018 |
87.7443 |
90.4331 |
92.825 |
94.8981 |
95.8844 |
95.4323 |
Yorkshire and The Humber |
19.7412 |
85.6536 |
88.9223 |
90.8691 |
93.3894 |
95.4119 |
96.4073 |
96.2381 |
Most of the country is doing really well, but it’s interesting to see that London has much lower vaccination rates across every category. I assume this is due to a combination of vaccine hesitancy, difficulty getting to the vaccination centres, or perhaps there’s an error with the data.
This isn’t a perfect calculation though because we’re assigning equal weight to each local area, which will vary in size. That means that we might be giving too much weight to smaller places with especially high or low vaccine uptake.
Let’s instead sum together the vaccinations given and populations per region and compute the percentages again. First we’ll create DataFrames for each region:
population.loc[:, "Region Name (administrative)"] = vaccinations["Region Name (administrative)"]

population_by_region = population.groupby(["Region Name (administrative)"]).sum()
population_by_region.insert(0, "Region", list(population_by_region.index))

vaccinations_by_region = vaccinations.groupby(["Region Name (administrative)"]).sum()
vaccinations_by_region.insert(0, "Region", list(vaccinations_by_region.index))| Region | Under 50 | 50-54 | 55-59 | 60-64 | 65-69 | 70-74 | 75-79 | 80+ |
|---|---|---|---|---|---|---|---|---|
East Midlands |
3170332 |
364235 |
356411 |
304211 |
261878 |
265843 |
193933 |
249586 |
East of England |
4165578 |
470144 |
456846 |
387478 |
331616 |
344449 |
252007 |
346692 |
London |
7592384 |
664924 |
587034 |
458373 |
342329 |
293428 |
204762 |
297433 |
North East |
1687882 |
193270 |
200330 |
180677 |
154636 |
150338 |
102373 |
140390 |
North West |
4953735 |
549622 |
544180 |
465484 |
389203 |
388096 |
274374 |
364876 |
South East |
6112065 |
695721 |
676804 |
570183 |
480072 |
493718 |
365478 |
510052 |
South West |
3496476 |
415359 |
424070 |
374972 |
333106 |
349326 |
260864 |
355024 |
West Midlands |
4019092 |
439809 |
418626 |
356127 |
304688 |
300890 |
230075 |
308908 |
Yorkshire and The Humber |
3670427 |
404075 |
392613 |
341298 |
289223 |
289865 |
204261 |
277539 |
| Region | Under 50 | 50-54 | 55-59 | 60-64 | 65-69 | 70-74 | 75-79 | 80+ |
|---|---|---|---|---|---|---|---|---|
East Midlands |
658569 |
310156 |
312653 |
274052 |
243321 |
253103 |
186500 |
239377 |
East of England |
755452 |
399663 |
400596 |
347169 |
305122 |
325649 |
241126 |
332207 |
London |
1097594 |
459513 |
428659 |
352909 |
276040 |
248388 |
176083 |
255922 |
North East |
313030 |
164486 |
178221 |
165482 |
145496 |
144315 |
99336 |
135749 |
North West |
937404 |
451446 |
466463 |
412713 |
356303 |
365507 |
261756 |
347927 |
South East |
1078781 |
594115 |
594208 |
511143 |
442087 |
466018 |
348965 |
487877 |
South West |
668237 |
361313 |
377659 |
339592 |
309999 |
332055 |
250762 |
342276 |
West Midlands |
763887 |
361823 |
357134 |
315110 |
278568 |
283073 |
218910 |
291583 |
Yorkshire and The Humber |
694645 |
339544 |
344640 |
307351 |
268164 |
275646 |
196338 |
266059 |
And now we can compute the vaccination rate per region:
vaccination_rates_by_region = ((vaccinations_by_region
    .select_dtypes(exclude='object')
    .div(population_by_region.select_dtypes(exclude='object')) * 100)
    .combine_first(vaccinations_by_region)[vaccinations_by_region.columns])
vaccination_rates_by_region = vaccination_rates_by_region.convert_dtypes()| Region | Under 50 | 50-54 | 55-59 | 60-64 | 65-69 | 70-74 | 75-79 | 80+ |
|---|---|---|---|---|---|---|---|---|
East Midlands |
20.7729 |
85.1527 |
87.7226 |
90.0862 |
92.9139 |
95.2077 |
96.1672 |
95.9096 |
East of England |
18.1356 |
85.0086 |
87.6873 |
89.5971 |
92.0106 |
94.542 |
95.6823 |
95.8219 |
London |
14.4565 |
69.1076 |
73.0212 |
76.9917 |
80.6359 |
84.6504 |
85.994 |
86.0436 |
North East |
18.5457 |
85.1068 |
88.9637 |
91.59 |
94.0893 |
95.9937 |
97.0334 |
96.6942 |
North West |
18.9232 |
82.1375 |
85.7185 |
88.6632 |
91.5468 |
94.1795 |
95.4012 |
95.3549 |
South East |
17.65 |
85.3956 |
87.7962 |
89.6454 |
92.0876 |
94.3895 |
95.4818 |
95.6524 |
South West |
19.1117 |
86.9881 |
89.0558 |
90.5646 |
93.0632 |
95.0559 |
96.1275 |
96.4093 |
West Midlands |
19.0065 |
82.2682 |
85.311 |
88.4825 |
91.4273 |
94.0786 |
95.1472 |
94.3915 |
Yorkshire and The Humber |
18.9255 |
84.0299 |
87.7811 |
90.0536 |
92.7188 |
95.0946 |
96.1211 |
95.8636 |
London is doing slightly better on some of the age groups measured like this, but still seems to be behind the other regions.
We could do some further analysis to figure out if there are specific areas in London that have lower uptake, but I think that can wait for another post.
About the author
I'm currently working on short form content at ClickHouse. I publish short 5 minute videos showing how to solve data problems on YouTube @LearnDataWithMark. I previously worked on graph analytics at Neo4j, where I also co-authored the O'Reilly Graph Algorithms Book with Amy Hodler.